
Chapter 3
This chapter traces the rapid development of English mapmaking during the sixteenth century. New surveying instruments, copperplate engraving and the demands of navigators and landowners transformed maps from rare manuscripts into increasingly accurate and widely available documents.
Navigators, Landowners and Estate Surveyors
Although the first half of the sixteenth century produced only one notable English map, it was a period of rapid progress in every branch of cartography. Much of this progress arose from developments elsewhere in Europe.
During the early fifteenth century, Byzantine scholars brought manuscript copies of Claudius Ptolemy’s Geographia to Italy. Compiled at Alexandria during the second century, this remarkable work provided both a description of the known world and a method for mapping large areas through a network of latitude and longitude.
Englishmen travelling abroad in increasing numbers after 1520 encountered Ptolemy’s work and the Continental scholars who were continuing it. They returned with a growing enthusiasm for geography and cartography. During the Age of Discovery, new techniques for navigation, surveying and printing maps from engraved copper plates inspired mathematicians and instrument makers to ever greater invention.
Henry VIII and England’s Early Sea Charts
Henry VIII was himself a product of the Renaissance. He had a love of music and poetry, considerable skill in feats of arms and a breadth of vision that proved valuable to a country still behind Portugal, Spain and France in navigation.
In 1520 English seamen possessed very few sea charts other than those drawn by foreigners. Like Chaucer’s Shipman from Dartmouth, they may have “known well all the havens” from Gotland to Cape Finisterre and onward into the Mediterranean, but much of their sailing remained coastwise. Henry encouraged skilled navigators and mathematicians, principally from northern France, to instruct his pilots in nautical science.
In 1514 he granted a royal charter to the organisation that became Trinity House, established to assist coastal mariners through pilots, beacons, landmarks and buoys. Charts were subsequently produced for numerous English harbours, extending from the Bristol Channel around the coast to Newcastle.
Several early charts made by English mapmakers, together with contemporary copies, survive in important library collections. These are essentially bird’s-eye views of ports, observed from a short distance offshore. Drawn on parchment and coloured with washes or paint, they combine practical information with highly pictorial detail.
A graceful ship often rides in the foreground, surrounded by marked shoals, sandbanks and sea depths measured in fathoms. Beyond it, sandy beaches, shingle, rocks and cliffs are depicted in plan. Cliffs appear rolled back to reveal their faces, while boulders are frequently exaggerated. Churches, beacons, windmills and isolated trees rise behind the shoreline as landmarks by which a mariner could steer. The charts were intended for use with “rutters”, or written books of sailing directions.
The Growth of Estate Surveying
Henry VIII’s dissolution of the monasteries between 1536 and 1540, followed by grants of former monastic estates to laymen, helped create a new landed gentry. Many of these owners were commercially minded and commissioned written surveys of their newly acquired property.
This gradually brought into existence a body of professional lay surveyors distinct from manorial stewards. The surveyors advised on manorial law and estate management, while the men who physically measured parcels of land and established boundaries were commonly known as landmeters.
Early measurement relied upon simple geometry and cords of a fixed number of perches, treated with resin to reduce shrinkage. The first English printed work devoted to the subject, Richard Benese’s This Boke Sheweth the Maner of Measurynge of All Maner of Lande, appeared in 1537.
Copperplate Engraving and George Lily’s Map
The ability to print maps from engraved copperplates was developed in Italy during the fifteenth century. In 1477 an edition of Ptolemy’s Geographia containing copper-engraved maps was published in Bologna. Copper engraving offered enormous cartographical, artistic and commercial possibilities.
The first important separately engraved map of the British Isles was published in Rome in 1546. Its author, George Lily, belonged to the household of the exiled English cardinal Reginald Pole, and the map was produced with the assistance of English Catholic exiles living in Rome.

The British Isles by George Lily, 1546
Lily’s map, with its firm yet delicate lines, stately cartouches and clear sloping italic lettering, must have been a revelation to English viewers. It was left uncoloured, avoiding the risk that applied colour might obscure important engraved detail. Symbols therefore became the principal means of identifying the map’s features.
The sea is stippled and brought to life by finely drawn ships and enormous sea creatures. Hatching emphasises the coastline, groups of bushy trees represent forests and gently curving shaded lines indicate lower hills. Mountain ranges resemble conical sugar loaves. Towns appear as small groups of buildings, with a tiny circle marking the centre from which distances could be measured.

The Use of the Theodolite
From Leonard Digges’ Pantometria, 1571
Curiously, Lily showed no roads, although evidence suggests that he consulted a copy of the medieval Gough Map. The influence of Ptolemy can be seen in the map’s northward orientation and its border marked with degrees of latitude and longitude. Its scale takes the form of an elegantly engraved rule divided into 200 Roman or Italian miles.
The representation of Scotland and its islands is far superior to anything that had appeared previously and was probably informed by a chart made following James V’s voyage around the Scottish coast in 1540. Ireland, however, remains barely recognisable. After Lily returned to England, copies of his map were printed in London in 1555.
Triangulation and the Plane Table
Much English knowledge of sixteenth-century mapmaking came through Flemish mathematicians, instrument makers and engravers. Gerard Mercator, one of the most influential cartographers of the period, was born in Flanders.
In 1533 Gemma Frisius of Louvain described the use of triangulation for surveying. In The Cosmographical Glasse of 1559, William Cuningham of Norwich described a comparable triangulation involving Norwich, Swarston and Wymondham.
Instruments such as the planimetre increasingly gave way to the plane table. This portable rectangular table allowed a surveyor to secure a sheet of paper and draw measured sight lines directly in the field with an alidade, or sighted ruler.

An Illustration of Early Triangulation
From William Cuningham’s Cosmographical Glasse, 1559
Mercator’s Map of 1564
By 1564 a generation of young Elizabethans was discovering the history, antiquities and literature of England with new pride and enthusiasm. Their desire to see the country’s cities and shires mapped was encouraged by the publication that year of Gerard Mercator’s influential map of the British Isles.

Gerard Mercator’s Map of the British Isles, 1564
Mercator based much of the map upon information supplied by English scholars, including Dr John Dee. By 1570 the number of skilled English surveyors had increased substantially. William Cecil commissioned maps for his own use, while members of the new nobility increasingly commissioned plans of their estates.

Wilton, Wiltshire
Drawn around 1563 for a survey of the estates of William Herbert, 1st Earl of Pembroke
Antiquaries, Noble Parks and Ocean Voyages, 1570–1600
By 1570 the Dutch, aided by their exceptional skill in copper engraving, had replaced the Italians as the principal suppliers of maps to Europe. Their cartographical knowledge was also reaching England through Protestant craftsmen fleeing persecution in the Spanish Netherlands.
In that year Abraham Ortelius of Antwerp published his celebrated world atlas, the Theatrum Orbis Terrarum. It was enthusiastically received by educated English readers whose interest in cosmography, geography and the history of their own country was rapidly increasing.
New Instruments and Engraved Town Plans
Leonard Digges’ important surveying work Pantometria was published by his son Thomas in 1571. Digges brought greater mathematical accuracy to established surveying methods and described an instrument of his own invention, the “Topographical Instrument”. Its principles resembled those of the modern theodolite, although some time passed before instruments of this kind entered widespread production and use.
The first map known to have been engraved on copper in England depicted Palestine and appeared in the first edition of the Bishops’ Bible. It was produced by Humphrey Cole, a goldsmith at the Royal Mint and an accomplished maker of scientific instruments.
The map’s style resembled that of George Lily, but its cartouche combined Italian strapwork with birds, flowers, fruit and serpents—decoration reflecting the increasingly influential Dutch taste for ornament. Rivers were shown with flowing lines and mountains were shaded consistently on one side, establishing conventions that would be widely copied.
With the possible exception of the view of Norwich in William Cuningham’s Cosmographical Glasse of 1559, the first English town plan engraved on copper was Richard Lyne’s map of Cambridge, published in 1572. Drawn as a bird’s-eye plan and profile, it remains an absorbing record of the Tudor town.

Cambridge, 1572, by Richard Lyne
Christopher Saxton and the First County Atlas
Christopher Saxton, a young surveyor from Yorkshire, was the man destined to produce the national atlas towards which these developments had been leading. In 1573 Thomas Seckford, a wealthy Suffolk gentleman and one of Elizabeth I’s Masters of Requests, commissioned Saxton to map the counties of England and Wales. Seckford undertook to finance their engraving and publication.
There is evidence that the maps may originally have been intended to accompany Raphael Holinshed’s Chronicles of England, Scotland and Ireland, then in preparation. Seckford eventually published Saxton’s atlas as an independent work.
Saxton’s first maps were engraved in 1574. Others followed in rapid succession, and the atlas—comprising a general map of England and Wales and thirty-four county maps—was completed in 1579. Elizabeth I showed an early interest in the undertaking, and the royal arms, accompanied by a lion and dragon, appeared prominently upon the maps.
For one man to survey and map England and Wales single-handedly in six years would have been an extraordinary achievement. Saxton undoubtedly consulted existing maps lent to him by antiquaries, officials and publishers, including William Lambarde and possibly John Wolfe. These sources allowed him to check and supplement the observations he made while travelling, generally on horseback.
Little is recorded about Saxton’s surveying methods. He probably made compass sketches and used a plane table, assisted by local knowledge. He carried an open letter from the Queen instructing mayors and justices to help him and to provide guides to suitable towns, castles and hills from which he could view the surrounding country.
Several smaller counties were combined on a single sheet, while larger counties received individual maps. Yorkshire, Saxton’s home county and the largest in England, occupied a double sheet. Scales consequently varied from approximately one to three miles to the inch.
Numerous customary miles remained in use and differed considerably between districts, creating difficulties for surveyors. Saxton appears to have used the old English mile of 2,240 yards whenever possible. Hundred boundaries—the Hundreds being important administrative divisions—were marked with dotted lines on five of the county maps. Later publishers commonly distinguished these boundaries with hand-applied colour.
Despite the considerable travelling involved in the survey, Saxton showed no roads. The maps were engraved by several highly skilled craftsmen, including the Flemish refugees Remigius Hogenberg and Leonard Terwoort.

Map of Lincolnshire and Nottinghamshire by Christopher Saxton, 1576
The Art and Decoration of Saxton’s Maps
The elaborate cartouches and royal arms employed by Saxton’s engravers reflect the ornate style of the Dutch schools and the Elizabethan court’s love of display. Early impressions were richly coloured, sometimes with gold. Flowers, fruit, birds, animals and fish enliven Terwoort’s cartouches, while sea gods, nymphs, ships and creatures ornament Hogenberg’s work.
Colour was applied by hand, generally in the publisher’s workshop, although purchasers occasionally coloured their own copies. The pigments followed many of the conventions used in illuminated manuscripts, revived and extended under Dutch influence.
Some maps dated between 1576 and 1579 were engraved by English craftsmen, notably Augustine Ryther, one of the finest English map engravers of his generation. Ryther frequently signed himself “Anglus”, proudly identifying himself as English.
Decorative features included narrow borders resembling carved and painted frames, ships and monsters at sea, the arms of Seckford and the Queen, dividers placed above the scale and elaborately engraved scale rules.
A paling or fence surrounding an area represented the great parks enclosed by the new nobility, often from former common parish land. Mountains were coloured like large conical sugar loaves, offering little indication of their true height or gradient. They could be so prominent that nearby villages had to be displaced to remain visible.
Villages were usually represented by a single church tower, important towns by two or more towers and cities by several. The flowing italic lettering introduced by foreign copper engravers appears in some of its most elegant forms.
Saxton used variations in lettering to indicate the relative importance of features. Small italic lettering identified minor settlements; larger and heavier italics marked towns, forests, chases, moors and mountain ranges; and prominent towns and Hundreds appeared in italic capitals.
Saxton’s general map of England and Wales, engraved by Ryther, was both an artistic and cartographical masterpiece. A larger map published at Seckford’s expense in 1583 remained an authoritative representation of England for much of the following century.
The maps used a conical projection derived from Ptolemy, with degrees and minutes of latitude and longitude shown in their margins. Their scales listed “Long”, “Middle” and “Short” miles, corresponding respectively to approximately 1,920, 1,760 and 1,600 yards.
Saxton’s work established a new standard for printed English maps and demonstrated that detailed county maps could be reproduced and sold in considerable numbers. Impressions continued to be taken from the original plates around 1600, although the increasingly worn engraving produced weaker prints.
John Norden and a New Approach to Mapping
John Norden’s maps were exceptionally original and reflected the spirit of independent investigation found among scholars and the expanding middle classes of the 1590s.
Norden planned a new survey of England entitled Speculum Britanniae, combining county maps with historical and antiquarian descriptions. A lack of sustained patronage prevented completion of the ambitious project, but he succeeded in publishing maps of several counties and plans of London and Westminster between 1593 and 1598.
Frequently short of money, Norden remained a tireless worker. He surveyed estates throughout England, including lands belonging to the Duchy of Cornwall and the Honour of Windsor, and published valuable works on surveying and roads.
His engraved county maps introduced several features that would become familiar to later map users. Roads appeared as paired dotted lines. Letters and figures arranged along the borders created an early reference grid, while divisions marked upon the inner border supplied a simple marginal scale.
Norden also employed a distinctive symbol for a battlefield when marking the Battle of Barnet. The now familiar pair of crossed swords may derive from this early convention.
His imaginative tables of symbols identified the houses of gentlemen and noblemen, royal residences and decayed places. The houses and coats of arms of patrons were partly included to attract influential subscribers. For the next two centuries, mapmakers continued to depend upon patrons and often displayed the arms and seats of prominent families on maps offered for sale.
Norden also introduced triangular tables showing distances between towns, a device subsequently adopted on many road maps intended for travellers.
Estate Plans, Coastal Defences and the Agas Map
After 1580 maps became increasingly numerous. They included town plans, estate surveys and maps of harbours and coastal districts prepared for the government.
Ralph Agas produced a number of accomplished estate and town plans, while those drawn by the royal surveyor Robert Adams rank among the most delicate surviving works of the period. Plans of coastal defences and warning beacons were hurriedly prepared during the threat posed by the Spanish Armada.
One such plan of Weybourne in Norfolk carried the revealing note: “Reason would a scale but time permits not.” Among the finest engraved town plans were Remigius Hogenberg’s Exeter of 1587 and the plan of Oxford associated with Ralph Agas and engraved by Augustine Ryther in 1588.
London naturally attracted numerous artists and surveyors. The large bird’s-eye plan traditionally known as the Agas Map—surviving through later copies—provides one of the most fascinating representations of Elizabethan London.

The Agas Map of Elizabethan London
Maps, Sea Charts and Globes at the End of the Sixteenth Century
Maps of Wales, Scotland and Ireland
Maps of Wales and Scotland appeared soon after copperplate map engraving became established in England. John Leslie, Bishop of Ross, published a map of Scotland in 1578, although it was largely derived from George Lily’s earlier map of 1546.
The Welsh antiquary Humphrey Llwyd supplied a valuable map of Wales for Abraham Ortelius’s atlas, published at Antwerp in 1573. Christopher Saxton subsequently drew upon Llwyd’s work when preparing his own maps.
In Ireland, manuscript maps were made of several confiscated territories. As official documents, however, these surveys were not generally published. A substantial map of Ireland was produced in 1599 by Baptista Boazio, who had accompanied the Earl of Essex during his expedition to the country.
Like several earlier maps, Boazio’s work represented Ireland’s western coast as running almost directly north to south. Similar errors had misled captains from the defeated Spanish Armada. After rounding Teelin Head in Donegal, some attempted to sail south towards Spain and were wrecked upon the dangerous coasts of Mayo and Galway.
Lucas Waghenaer and the Mariners’ Mirrour
Although English seamen knew their own coast well, they possessed relatively few detailed printed charts. Dutch and Flemish navigators, drawing upon generations of maritime trade, had developed a more extensive knowledge of northern European waters.
The Dutch pilot Lucas Janszoon Waghenaer produced the first widely influential printed sea atlas during the 1580s. Its charts covered the coasts from the Baltic to the Iberian Peninsula and transformed the practical presentation of maritime information.

South-West Coast of England
From Lucas Waghenaer’s Mariners’ Mirrour, 1588
Admiral Lord Howard of Effingham quickly recognised the atlas’s value, particularly as Philip II of Spain was contemplating an invasion of England. Sir Anthony Ashley prepared an English translation, published in 1588 as The Mariners’ Mirrour, shortly before the Spanish Armada sailed.
Waghenaer’s charts developed the traditions of earlier manuscript coastal views. Shoals, sandbanks, shingle beaches and soundings were clearly marked, while good anchorages were indicated by an anchor symbol. Where the coast was steep or carried prominent landmarks, these features were tilted backwards so that they appeared in elevation even though the surrounding land and sea were drawn in plan.
An especially useful feature was the coastal profile shown along the upper part of a chart, illustrating the appearance of the land from several leagues offshore. Such profiles remained an important aid to recognition for later generations of navigators.
Waghenaer’s atlas became so familiar that English sailors used “Waggoner” as a general term for a book of sea charts for more than a century.

Detail of South-West Cornwall
From Waghenaer’s sea chart of the Cornish coast
The Molyneux Globes
The territories and trade acquired by Portugal and Spain in the Americas, Africa and Asia aroused intense interest in world geography among the English. Maps, charts and globes encouraged the overseas ambitions of figures such as John Dee, Martin Frobisher and Walter Raleigh.
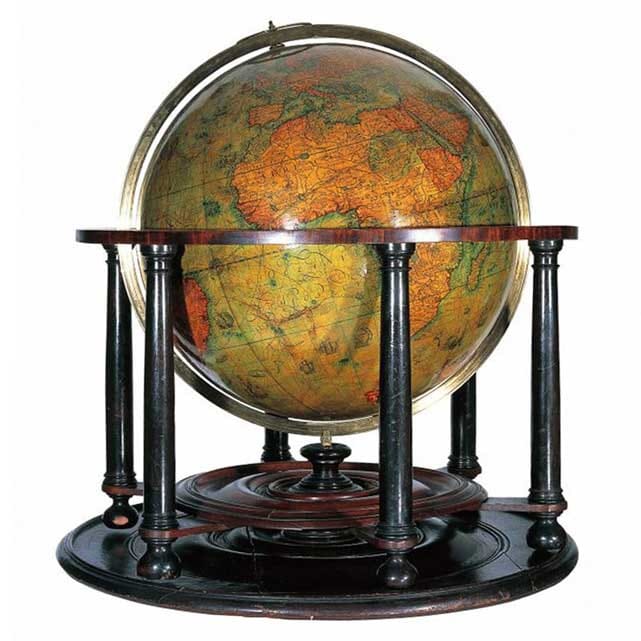
Among the most important surviving objects from this period are the terrestrial and celestial globes completed by Emery Molyneux in 1592 and preserved at the Middle Temple in London.
Molyneux was an accomplished maker of mathematical instruments. The engraved elliptical strips, or gores, covering his globes were prepared by the Flemish engraver Jodocus Hondius, while their production was financed by the London merchant William Sanderson, a patron of John Norden.
Several leading Elizabethan geographers and navigators contributed information to the terrestrial globe. They included Edward Wright, a Fellow of Gonville and Caius College and an important writer on nautical mathematics; John Davis, who had made three voyages in search of the North-West Passage; and Richard Hakluyt, a powerful advocate of English overseas exploration.

The Molyneux Terrestrial Globe, 1592
Image courtesy of the Honourable Society of the Middle Temple
Edward Wright and the Mercator Projection
English captains such as Frobisher and Drake commonly carried globes when undertaking ocean voyages because satisfactory charts were scarce. Many available charts were crossed by radiating lines from compass roses. These represented constant bearings on a flat surface but did not accurately describe a constant course across the curved surface of the Earth.
Charts constructed with conical or so-called equidistant projections also created navigational problems over long distances. Gerard Mercator had addressed this difficulty in his celebrated world map of 1569, arranging straight meridians and parallels at right angles and progressively increasing the spacing of latitude towards the poles.
This allowed a rhumb line—a course maintaining a constant compass bearing—to appear as a straight line. Mercator, however, did not publish a complete mathematical explanation of his method.
In 1599 Edward Wright supplied the necessary calculations and tables in his work Certaine Errors in Navigation. His explanation enabled trained navigators and chartmakers to construct the projection accurately. Mercator’s projection, underpinned by Wright’s mathematics, subsequently became fundamental to oceanic chartmaking.
On Wright’s chart, and on many maps produced until around 1700, longitude was calculated eastwards around the globe. A position five degrees west of the prime meridian could therefore be recorded as 355 degrees east. This convention reflected the influence of Ptolemy, whose geographical system described locations eastward from a prime meridian in the Atlantic.

Detail from Saxton’s Map of Lincolnshire and Nottinghamshire
Explore Historic British Maps
The achievements of Lily, Mercator, Saxton, Norden, Waghenaer and Wright transformed the mapping of Britain during the sixteenth century. Their work established conventions of surveying, engraving, lettering and navigation that influenced mapmakers for generations.
Reproductions connected with this history can be found in our collection of old maps of Great Britain, including maps derived from several of the landmark works discussed in this chapter.