Chapter 4
In 1601 there appeared a collective destined to dominate English cartography for two and a half centuries namely the publishers. Between 1601 and 1603 copies of a map of the British Isles and large, well-engraved maps of twelve of the counties were issued for sale here. Most of them bore neither imprint nor date, but it is most likely that they were engraved and printed at Antwerp and published by Hans Woutneel, a Flemish engraver living in London and a friend of Ortelius.

Hans Woutneel Antique Map of Hertfordshire
Though copied almost literally from Saxton’s and Norden’s maps, they were uniform in that the roads and the Hundreds were shown on all, and some of Norden’s symbols adopted. English publishers soon joined in. An edition of William Camden’s well-known Britannia, a monument of patriotic learning, was issued in 1607 with a full set of county maps copied again with the exception of Pembrokeshire from those of Saxton and Norden, though with the ornament, colours and Norden’s roads omitted. Since they bear Saxton’s and Norden’s names, these are often mistaken for originals, though their small size and crowded features should make that error impossible. Many of them are beautifully engraved by William Hole, who was also the first Englishman to engrave music.

The Theatre of the Empire of Great Britaine
by John Speed, first published in 1611-12, is the best known of early English atlases. Speed was a prosperous member of the Company of Merchant Taylors whose work was drawing maps, writing devotional books and studying history. He came to the notice of Fulke Greville, Philip Sidney’s friend, who paid him a stipend to write a History of Great Britaine. The Theatre was originally only intended to illustrate the History, but the part proved greater than the whole and the History is deservedly forgotten. Nearly all the maps were close copies of those of Saxton and Norden, with the addition “Performed by John Speed.” His performance consisted mainly in covering the face of each county map with the coats of arms of notables who had borne a county title and with historical and antiquarian engravings, legends, and filling the margins of the general maps of the four countries with useful costume figures of their nobility, gentry and peasants. Yet he introduced two valuable innovations which were adopted by most of his successors being delightful little plans of the county towns inset on the face of each map and a historical description, like those already usual on Continental maps, printed on the back. These plans, many of which have not yet been traced to their sources, are perhaps― when uncoloured-the best things published in a period of decline in English cartography. Speed drew upon every available source of information, revising Saxton’s Norfolk, Cheshire and Leicestershire from notes obtained from local antiquaries, and printing maps of the Isles of Man and Wight which had been drawn much earlier by Thomas Durham and William White. Ireland and Scotland he wisely copied from the best maps available, those in Mercator’s Atlas of 1595. These he obtained direct from Amsterdam; for though published in London the whole of the Theatre was engraved and printed at Amsterdam by Jodocus Hondius (Josse de Hondt). During his exile in London (c.1583-93) Hondius had realised the commercial possibilities in maps. Around 1593 he moved to Amsterdam, and in 1604 took over Mercator’s great cartographical establishment and became the leading map publisher in the world. In 1595 he engraved a magnificent chart of Drake’s circumnavigation of the globe. As English engravers were rare (Augustine Ryther is last heard of as a prisoner in the Tower in 1595) and no publisher possessed the copper plates and presses necessary for a work as large as the Theatre, Speed naturally turned to him.
The publication of the Theatre began a new era in English cartography. Publishers had earlier discovered both that a copper plate, once engraved, could be used over a long period, and that the public would always buy new maps whether there was anything new in them or not. Consequently, for well over a century the plates of Saxton’s and Speed’s maps were used by a succession of publishers for reprints on which only the imprint, date and sometimes the dedication and cartouche were altered. Thus, we cannot tell which edition of Speed Pepys used when, in 1662, looking for timber for the Navy, he “turned to the Forest of Deane in Speede’s Mapps, and there showed me how it lies”.

Speed map of Gloucestershire showing The Forest of Dean
More lately Speed’s maps were once again published from around 1956 initially by Porter Prints of York and then by ourselves The Old Map Company of Great Britain under the direction of Steve Plomer-Roberts, as reproductions on ‘antiqued parchment’. These were merchandised under the banner of ‘Your County in 1610’ and sold mainly in the gift shops of heritage sites around Great Britain up until around 2010. This operation was to introduce many to old maps having over the period published more than one million pieces. Certainly, the reissue of Saxton’s atlas in 1645, of Speed’s in 1646 and the publication of a careful copy of Saxton’s large map of England in 1644 “Useful for all Commanders for quartering of Soldiers” were all intended for impartial sale to both sides in the Civil War. These atlases had however to compete with serious rivals, which are still found in many English bookshops. While the absolutism of the Stuarts was dragging England into civil war, the Dutch Republic was strengthening her hold on an overseas empire which brought her enormous wealth and securing a virtual monopoly of the world’s maritime trade. And by 1640 the Dutch, who were good businessmen as well as good artists, were supplying the whole world with fine atlases, maps and charts and noble volumes of engraved views and plans. By 1850 the two greatest cartographical publishers in the world, Joan Blaeu and Jan Janszoon, were selling rival versions of Speed’s county maps in their atlases. No copyright law existed, and everybody copied everybody else’s maps ungrudgingly. Without major alteration the Dutch engravers transformed Speed’s somewhat randomly placed collection of images into clear and artistic maps. A few other single maps of this period, most of them published in connection with speculative “projects” for land reclamation, mines, mills and waterworks, were generally characterized by poor engraving, shoddy lettering and the absence of ornament and colour still survive.
ST. KITTS AND NEVIS

Chart by William Hack, c. 1687
Manuscript estate maps multiplied fast after 1603, for many wealthy merchants were setting up as country gentlemen, institutions like the Oxford and Cambridge Colleges were looking into the boundaries and rents of their widespread properties and disputes over the enclosure of common lands were increasing. Many of these were evidently surveyed by ‘Plaine Tablers’ such as one described by Ralph Aggas, “Mary, he was a plumber and had learned from a Painter: in less than an acre and a halfe he fel short at his cloaze by two perches at least”.
After 1630 many estate maps were enlivened by pictures of people ploughing or cutting corn in the fields, of cattle and horses grazing, and of carts and horsemen on the roads. These were probably inserted, not for ornament, but to distinguish arable land from pasture and high roads from lanes. Practically all surveyors continued to use “customary” miles of various lengths, but Edmund Gunter’s chain of 22 yards came into use about 1624. The Elizabethan colour conventions were still observed, Folkingham writing “Trees may have a sadder Greene, composed of White Lead and Verdigreece”. Roads were marked on none of these maps except Woutneel’s and the MS. maps.
The work in the sea-charts begun by Waghenaer in 1583 was continued by his countrymen, and their great sea-atlases, published from 1612 onwards, were the mainstay of mariners of all countries. The few English we have which have survived were the work of explorers or of exiles, save a fine chart on Mercator’s projection of Henry Hudson’s last, and fatal, voyage in search of the North West Passage, which shows the legendary Atlantic islands of Frisland and Buss, and a MS. chart of Hudson’s Bay and Strait drawn on a conical projection by William Baffin in 1615. By far the greatest of early English chart-makers was however . A son of Queen Elizabeth’s favourite, the Earl of Leicester, by the widowed Lady Sheffield, he failed to prove his legitimacy, and in 1605 left England in disgust to spend the rest of his life in Florence. His Arcano del Mare”The Secret of the Sea”, a maritime atlas of the whole world, came out n 1646-47, just before his death. In many ways it was a century before its time. It was the first sea atlas in which every chart was on Mercator’s projection, the first to give the magnetic declination of a large number of places, and the first to show the prevailing winds and currents at all important harbours and anchorages. His magnetic declinations are however unreliable. But the engraving is superb. Handsome compass roses, ships and little anchors are abundant, soundings are marked, and the coasts are shaded inwards, an improvement, at least for charts, on the usual custom of hatching outwards. Large engravings of the surveying and navigational instruments, the best of their day used or designed by Dudley are included, giving the work additional value.

The Secret of the Sea” by Robert Dudley 1646

NEW ROADS AND LATE BAROQUE 1660-1760
Under the first Stuarts and the Commonwealth the English people had learned, from hard experience, to think for themselves. The Restoration brought in an age of scientific experiment, led by the Royal Society, and released at the same time an energy as manifold as it was extraordinary in a nation of less than six million people. England had broken the supremacy of the Dutch both on the sea and in America when, in 1670, John Ogilby challenged their supremacy in cartography. His maps of Kent, Essex and Middlesex, 1670-78, though small, revived Norden’s carto-graphical principles. They showed roads in double lines and hamlets as small circles, there was a marginal index and many special symbols for post towns and the like set out in a “Table”. In Middlesex villages are denoted by the familiar church and circle in elevation, but towns are represented in a manner which marks the transition from elevation to plan. They are shown as groups of houses by the roadside with their gabled fronts facing upwards. This curious method was sometimes used later on estate plans to show the classic Palladian façades of gentlemen’s houses. Except on the ornamentation and on the boundaries of counties and Hundreds, colours were abandoned, as it was realized both that they obscured the details on maps and that they tended to rot the paper. Important features were distinguished by Roman letters instead of Italic, capitals of three sizes being used, though cursive Italics were retained for minor features.
Ogilby was aware that such maps would hardly help travellers. Yet although a large part of the nation had begun to travel, knowledge of the roads was so localized that guides were needed for every stage, his inn- keepers often acting in that capacity for Pepys. As skilled a surveyor as Norden, Ogilby had more organizing ability, for he had been in turn a fashionable dancing master, Master of the King’s Revels in Ireland, a translator of Homer and Virgil and a publisher. In 1675 he published Britannia, Volume I in which, on 100 large plates, all the roads of England and Wales were engraved to a scale of one inch to a mile. Such a road atlas had never been produced, or hardly imagined, in any country, and in interest and clearness the maps surpass our modern motoring maps. The main roads all start from the Standard at Cornhill in London and are carried outwards on continuous strip-maps which depict not only all the crossroads, bridges, hills and county boundaries to be crossed but diverse objects by the wayside. Legends such as “Enter a moore,” “A Gibbit” and “The Porcupine Inn” tell the traveller just what to expect. Dots along the roads indicate furlongs, enclosed roads are distinguished from open and a compass rose accompanies every strip. The Britannia was the first engraved atlas in which the statute mile was used throughout. The road distances had been measured by an army of surveyors using “Perambulators” or wheels on which every revolution was registered as on a modern cyclometer.

Section of Ogilby’s roadmap London to Holyhead
The value of Ogilby’s roadmaps was at once realized, and from then on no maps appeared without roads. The Britannia itself was four times republished, and a multitude of road atlases and road maps based upon it but reduced to handy sizes appeared from 1700 on to 1794. Even Saxton’s atlas, his large map of England and Speed’s Theatre reappeared in 1676-87 with roads added.
After 1675 the history of English cartography becomes to a great extent the history of publishers and of the gradual incorporation into their maps and charts of advances in geography, geodesy, hydrography, surveying, engraving, representative symbols, lettering, decorative art and colouring. Between 1680 and 1715 their publications quickly came to include atlases as well as single maps, issued in every size and in ever increasing volume. At first some of them stole information and copied maps, their most useful quarry being the atlases of the Dutch and French; but from 1690 onwards original developments of many kinds appeared. Surveys, small and sporadic but all contributing to give a more accurate image of the country, were carried out and useful information supplied, by local estate surveyors. After 1700 colour disappeared from the ornaments on maps and was continued only on boundaries. More important

From G. Collins’ Great Britain’s Coasting Pilot, 1693
was the substitution of the meridian of St. Paul’s for that of the Azores as the prime meridian. The earliest known map with this meridian is one of Hertfordshire published by John Seller in 1676, although the idea hadn’t actually originated with Seller. In fact, Charles II had founded the Royal Observatory at Greenwich in 1675 to settle the vexed questions of longitude, and Flamsteed, the first Astronomer Royal, fixed his sighting arc along that meridian; but probably national interest in the rebuilding of St. Paul’s determined the choice.
Many fine town plans were published during this period, especially after 1700, but that of London, surveyed by Ogilby, his partner, William Morgan, and others and published by Morgan in 1682, is probably the most impressive ever engraved in England. The scale is an inch to 300 feet, and together with a mass of other information it includes a most interesting list of all the streets, lanes, hospitals, inns, taverns, yards, courts, alleys and rents in London and Westminster.
Together with degrees and minutes of longitude, minutes of time east and west of the meridian were marked in the horizontal margins of many maps down to 1725; reference squares on maps, with marginal letters, were common. In 1721 John Senex substituted for the time honoured Ptolemaic scale, “English miles, 60 to 1 Degree” (of latitude), “English measured miles, 69 to a Degree,” which is not far wrong for statute miles.
For a long time there was little uniformity in symbols for towns and villages. Ogilby wrote in his Britannia, “Capital towns are described Ichnographically” or in plan, “and all other buildings Scenographically or in prospect,” that is, in elevation; but from 1678 to 1754 cities were generally represented either in plan or as little groups of towers, market towns and large villages by the customary church towers with circles, hamlets by plain circles. The towers were often poorly drawn, but some were very artistic, throwing long shadows eastwards as if they were bathed in soft afternoon sunshine. Hills were often similarly depicted. Left clear white on their western side, they look small and alluring, though in fact neither their height, slopes nor exact position is defined. Besides engraved Roman capitals, Roman printed letters came into use for the names of small towns. As time went on symbols were inserted for everything: cities, shire towns, market towns, judges’ circuits, bishoprics, medicinal waters, Roman stations, charity schools and different kinds of mills. Rectories and vicarages were distinguished by the letters R. and V., post towns by a curious sign, which was in vogue for a century, and, to quote from an explanation, “Parliamentary Boroughs have Stars annexed to them”.

London Actually Surveyed by Wm. Morgan 1682
John Rocque, a French surveyor and engraver who came to England about 1734, introduced a style all his own in map-making. Until about 1750 he was employed in making plans of the stately new mansions and parks belonging to noblemen and merchants which Evelyn and Defoe describe so frequently. During that work he seems to have acquired a habit of engraving cultivated land, gardens, pasture, heath and the like in a realistic way, as seen in plan. At any rate his maps of Shropshire, Middlesex, Berkshire and Surrey (1752-68) show a multitude of details found previously only upon MS. estate plans, which are as delightful to the eye as they are instructive in physiography and contemporary land utilization. He set a new standard in cartography by always depicting hills in plan. They are vertically shaded, that is, the light is supposed to fall upon them from directly above, so that the summits are white and the slopes shaded all round. Though not yet hachures, the lines of shading are thickest where the slopes are steep. In 1746 he published a famous plan of London on a scale of 5″ to the mile and accompanied by a list of streets, inns, closes, etc., even more fascinating than Morgan’s, and in the same year, London and the Country Ten Miles Round, which it is a joy to peruse. Except for two of Cornwall, Rocque’s county maps were the first on a large scale.

John Rocque 1754

Manuscript estate plans were, like their period, large but heavy in style. The writing hand of the time was also intricate calligraphy, and some estate plans bear fine exhibitions of the penman’s art, for in the provinces surveyors were usually also teachers of writing and of mathematics. One of their main

Dodderhill 1770
tasks was surveying for enclosure awards. From 1660 onwards parish common lands were steadily enclosed, usually by private Acts of Parliament passed after agreement among the inhabitants of the parish. Although waste lands were often awarded to the lord of the manor, these enclosures generally benefited the farmer and smallholder.
The style of decoration on cartouches between 1660 and 1700 was baroque, often coloured but poorly engraved and intricately adorned with heavy designs of flowers and fruit, plump cherubs and floating ribbons were mingled with uninspiring rustic scenes and Neptunes surrounded by splashing Nereids. The Late Renascence style in interior decoration, with its immense ceiling paintings of classical subjects by Verrio and Thornhill began to influence maps after 1710. Thus, Queen Anne and the first two Georges are often portrayed reclining upon clouds, dressed in buskins, wreaths and flimsy robes and twanging lyres, while the noble but submissive natives of the country represented offer them homage and gifts. The decoration in Bowen & Kitchin’s Large English Atlas is typical of its time, picturesque groups of country folk carrying on the occupation or industry peculiar to their county.

Detail from Hertfordshire in Bowen & Kitchin’s Large English Atlas
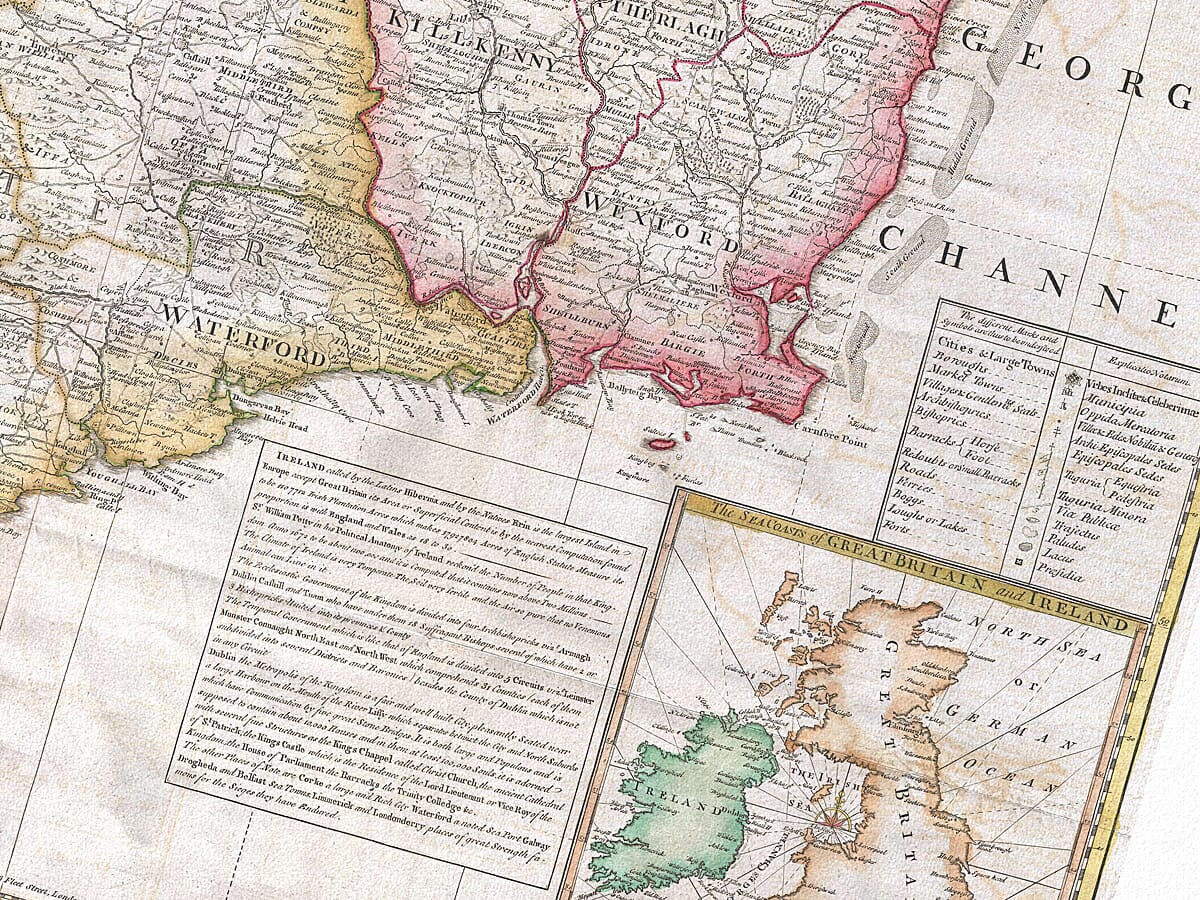
After the Civil War, the greater part of Ireland was confiscated by Cromwell, and the lands earmarked for “the adventurers for lands in Ireland, the arrears due to the soldiery there and of the public debt”. For this purpose Sir William Petty carried out a survey which was the most comprehensive and scientific survey of a large area made by any Englishman before 1755. The provincial and county maps in his atlas, Hiberniae Delineatio (1683), remained the standard for a century, being widely copied; but he did not publish his large-scale maps of 214 baronies because French corsairs captured them while they were on their way to London. In 1752 John Noble and James Keenan surveyed and published a good map of county Kildare on a scale of 1″ to a mile; this being the first map of its kind produced by Irishmen.
Rocque went to Ireland in around 1754, and soon published fine plans of Dublin and Cork and maps of counties Dublin and Armagh. The latter owe much to Petty’s survey, but are larger and much more artistic.
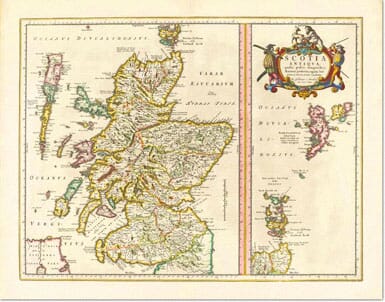
In Scotland, Timothy Pont, a minister, who was inspired by the example of his contemporary, Saxton, and travelled over much of the country between 1595 and 1608 making topographical drawings; but he knew nothing of surveying, and his manuscripts were neglected after his death. In around 1639 Robert Gordon of Straloch began the labour of constructing readable maps from them, while Sir John Scott of Scotstarvet undertook to raise money and have the atlas published by Joan Blaeu, the only possible competent engraver at the time. It was published in Part V of Blaeu’s Atlas Major in 1654. After 1678 Scotland was mapped fairly thoroughly, [LINK ] though piecemeal, by a number of men. The Union with England in 1707 brought Scotland into the market for English publishers, and on Moll’s large map, The North Part of Britain called Scotland (1714), the outline of the country was greatly improved. After the 1715 rebellion the government had to bestir itself, and in 1725 General Wade began his famous military roads southwards from Inverness. After the 1745, however, the dread inspired by clansmen was so great that in 1747 Colonel Watson was ordered to begin a detailed military survey of the Highlands on a scale of 1″=1,000 yards, which later included part of the Lowlands. It was completed in 1755, having been mainly carried out by William Roy, who began as Watson’s clerk but ended as his deputy and later became one of the founders of the Ordnance Survey. The maps, which cover 84 rolls and 38 sections, are among our national treasures in the British Museum. Meanwhile John Laurie’s map of the Lothians, published in 1745, was the first British map on which the altitudes of hills-very necessary in Scotland-were given. They were in feet above sea-level, but without any datum line, and vertical shading was used to portray the slopes.
Continued > > >